The eBird bar charts give us "frequency:
the percentage of checklists reporting that species within a specified
date range" - so it gives you an idea of how likely are you to encounter
that species during that time frame in appropriate habitat.
These data
don't really tell us about the actual abundance of the species - the
size of their populations (because of the variety of counting methods
and observer effort used to get these eBird data, and other things) ... but ...
intuitively, if there are changes in frequency for really common birds -
that must say something.
So, I have compared a species'
frequency from December 2021 to the frequency from 2016 - in a very
imprecise way that would not stand up to statistical analysis. I have
summed the year's frequency for 2016 and for 2021 and compared them by
subtracting the 2016 number from the 2021 number. Here are the results
for the top and bottom 30 species - the 30 species that show the
greatest increase or decrease in frequency since 2016.
eBird Regional District of East Kootenay Frequency Difference
Showing 60 of the greatest frequency differences between the sum of eBird frequency for 2016 compared to the sum of eBird frequency for 2021 for 60 species in the Regional District of East Kootenay
| English
Name |
|
BC_Game |
|
Abundance |
|
Diff_2021 |
| American
Crow |
|
|
|
vc |
|
3.912559532 |
| Common
Raven |
|
g |
|
vc |
|
3.267595681 |
| Canada
Goose |
|
g |
|
vc |
|
2.520634189 |
| Northern
Flicker |
|
|
|
vc |
|
2.459357979 |
| Bald
Eagle |
|
|
|
c |
|
2.431250047 |
| Mallard |
|
g |
|
vc |
|
2.289990853 |
| Red-breasted
Nuthatch |
|
|
|
vc |
|
2.125886915 |
| Dark-eyed
Junco |
|
|
|
vc |
|
1.596265554 |
| American
Robin |
|
|
|
vc |
|
1.506643623 |
| Rock
Pigeon |
|
g |
|
vc |
|
1.454782405 |
| Blue Jay |
|
|
|
sc |
|
1.313311740 |
| Eurasian
Collared-Dove |
|
g |
|
sc |
|
1.255200966 |
| Black-billed
Magpie |
|
|
|
c |
|
1.118253242 |
| Bufflehead |
|
g |
|
c |
|
1.115452534 |
| American
Wigeon |
|
g |
|
c |
|
1.098214353 |
| American
Coot |
|
g |
|
c |
|
1.089445026 |
| Turkey
Vulture |
|
|
|
sc |
|
0.987196201 |
| Pine
Siskin |
|
|
|
vc |
|
0.920770842 |
| European
Starling |
|
|
|
vc |
|
0.916598597 |
| Townsend's
Solitaire |
|
|
|
c |
|
0.910150795 |
| Red-tailed
Hawk |
|
|
|
c |
|
0.876833943 |
| Ring-necked
Duck |
|
g |
|
c |
|
0.863093321 |
| Trumpeter
Swan |
|
|
|
sr |
|
0.862401577 |
| Tree
Swallow |
|
|
|
vc |
|
0.835159263 |
| Osprey |
|
|
|
c |
|
0.786232455 |
| Green-winged
Teal |
|
g |
|
c |
|
0.763347806 |
| Vesper
Sparrow |
|
|
|
c |
|
0.760730881 |
| Western
Bluebird |
|
|
|
c |
|
0.744897794 |
| Eastern
Kingbird |
|
|
|
c |
|
0.731731785 |
| Killdeer |
|
|
|
c |
|
0.730740303 |
| |
|
|
|
|
|
|
| English Name |
|
BC_Game |
|
Abundance |
|
Diff_2021 |
| Ruffed
Grouse |
|
g |
|
c |
|
-0.068174952 |
| Barrow's
Goldeneye |
|
|
|
sc |
|
-0.074931879 |
| Calliope
Hummingbird |
|
|
|
sc |
|
-0.088113133 |
| White-crowned
Sparrow |
|
|
|
sc |
|
-0.088878485 |
| Black-headed
Grosbeak |
|
|
|
sr |
|
-0.098174169 |
| Brown-headed
Cowbird |
|
|
|
c |
|
-0.098403200 |
| Common
Grackle |
|
|
|
sc |
|
-0.100154859 |
| Northern
Shrike |
|
|
|
sc |
|
-0.116332190 |
| Black
Tern |
|
|
|
unc |
|
-0.122280235 |
| White-throated
Sparrow |
|
|
|
sr |
|
-0.140874202 |
| Northern
Waterthrush |
|
|
|
c |
|
-0.155879991 |
| MacGillivray's
Warbler |
|
|
|
c |
|
-0.172119636 |
| House
Finch |
|
|
|
vc |
|
-0.181452069 |
| Clark's
Nutcracker |
|
|
|
vc |
|
-0.199776593 |
| Warbling
Vireo |
|
|
|
c |
|
-0.228123752 |
| Great
Blue Heron |
|
|
|
sc |
|
-0.229904927 |
| Townsend's
Warbler |
|
|
|
c |
|
-0.245286146 |
| Hairy
Woodpecker |
|
|
|
vc |
|
-0.249200275 |
| Song
Sparrow |
|
|
|
vc |
|
-0.265412316 |
| American
Dipper |
|
|
|
c |
|
-0.286035808 |
| Vaux's
Swift |
|
|
|
c |
|
-0.316657000 |
| Rufous
Hummingbird |
|
|
|
c |
|
-0.454750968 |
| Bohemian
Waxwing |
|
|
|
c |
|
-0.540717624 |
| Common
Redpoll |
|
|
|
c |
|
-0.571101261 |
| Pine
Grosbeak |
|
|
|
c |
|
-0.779422544 |
| Black-capped
Chickadee |
|
|
|
vc |
|
-0.803501285 |
| Evening
Grosbeak |
|
|
|
c |
|
-0.962873544 |
| White-breasted
Nuthatch |
|
|
|
sc |
|
-1.054325951 |
| Downy
Woodpecker |
|
|
|
vc |
|
-1.114156219 |
| Steller's
Jay |
|
|
|
c |
|
-1.154665009 |
So, now you are more likely to see American Crow, Common Raven, Canada Goose, Northern Flicker, and Bald Eagle, etc. when you go out birding; and less likely to see Steller's Jay, Downy Woodpecker, White-breasted Nuthatch, Evening Grosbeak, Black-capped Chickadee, etc. than you would have five years ago.
I think decreases in the very common (vc) species indicates there are some population problems with them: they used to be commonly seen but are seen less often now, probably because there are fewer of them around, not because of some change in their behaviour or birders' behaviour. And fewer of them around either because their populations are smaller or because there is less habitat available for them.
This is troublesome to think about for Downy Woodpecker and Black-capped Chickadee, especially. Why? They are easily identifyable and still fairly common but why would they be reported less unless there are just fewer of them to report? And Hairy Woodpecker and Song Sparrow? What's up with them? And Rufous Hummingbird - hmm.
Clark's Nutcrackers and Great Blue Heron we know are having trouble. Nutcrackers with food supply in higher elevations: less productive limber pine seed crop, limber seeds having higher energy rewards than lodgepole pine. And Herons having trouble with finding suitable nesting sites - and maybe more predation from a higher Bald Eagle population?
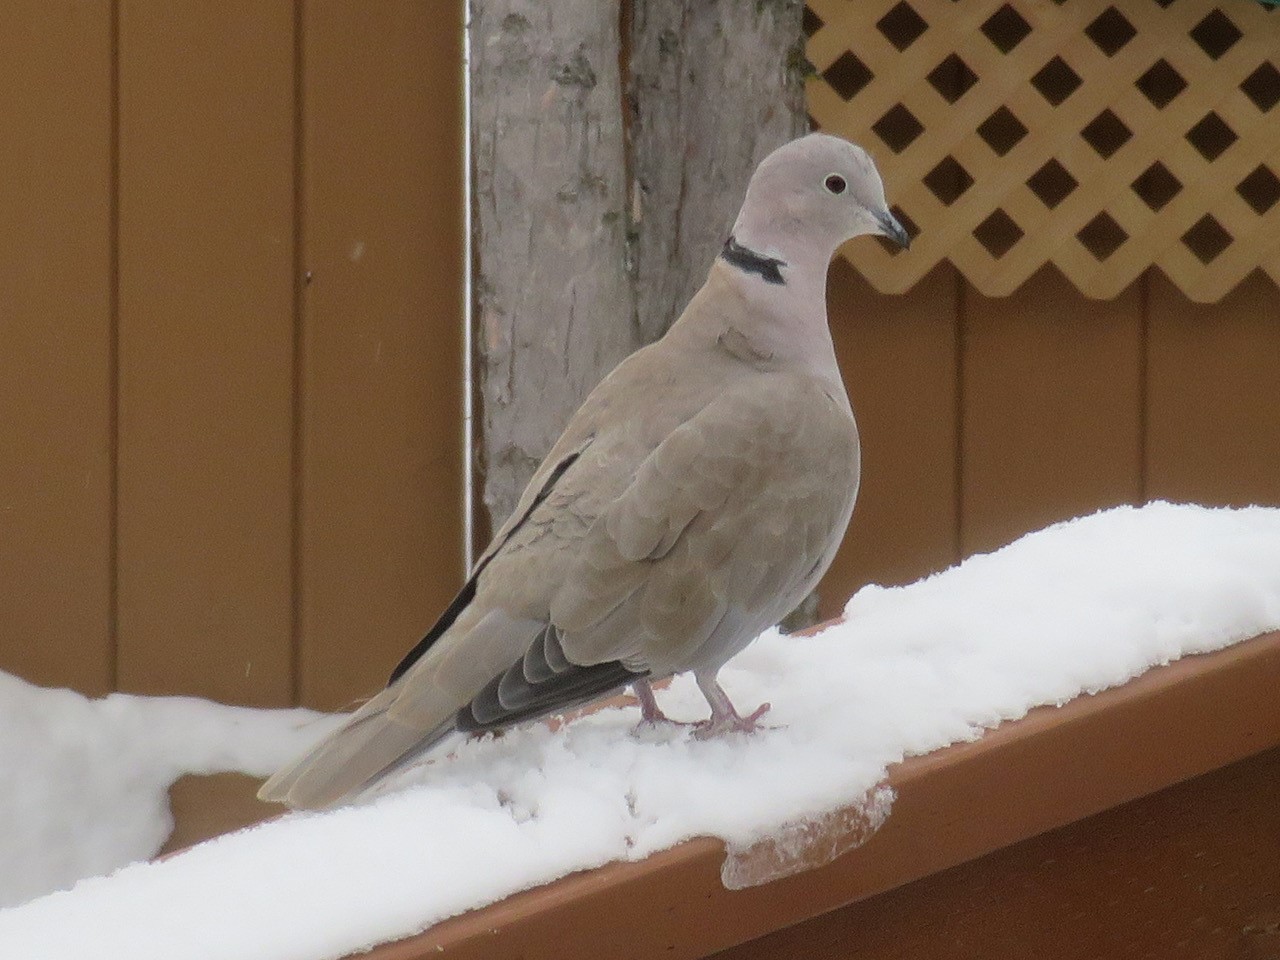
It's good to see Northern Flicker increase in frequency - they carve out lots of cavities for other birds to use as nests and help recycle dead trees. Eurasian Collared-Dove we know has just "recently" arrived in the area and their population is currently growing rapidly. They used to be rare but it didn't take long for them to become quite noticeable in human-settled areas.
The increasing frequency of seeing Bald Eagles: if their numbers are indeed growing, that is fine - we need "top of the food chain" species as part of the overall balance. Why would they be increasing? Maybe warmer springs lets them get going earlier laying eggs and that translates to better survival of young? Maybe they are taking advantage of having more Mallards around to eat?
So, yeah, the 2021 frequency data is cumulative and includes the same data as in the 2016 number. Both frequency numbers contain all the data in eBird up until that point in time. That adds some evening. This is not comparing 2016 and earlier to the time frame of 2017 - 2021.
You can see the eBird bar chart here: https://ebird.org/barchart?byr=1900&eyr=2020&bmo=1&emo=12&r=CA-BC-EK
And you can change the dates to see the differences for yourself, and you can download the numbers - scroll to bottom, "Download Histogram Data".
Yes, there are more eBirders now, but this is frequency data - so that is factored in. What is not factored in is skill of the eBirder at detection and many other things - that's why this discussion is not very rigorous scientifically but it does give one something to think about.